0.5μm: A "Perfect Ruler" That Kills Yield
— When You Measure Every Problem with One Ruler, You'll Never See the Real Problem
Let me start with a counterintuitive fact.
A precision machining workshop in East China set its spindle vibration monitoring threshold at 0.5μm — the industry benchmark, the equipment supplier's recommendation, even the customer audit pass line.
Everyone thought this line was well-managed.
Vibration exceeds the limit? Shut down immediately. No ambiguity. Equipment maintenance records were textbook-perfect. Annual shutdowns: only 11 times, 40% below the industry average.
But yield?
91.3%.
In precision machining, what does 91% mean? It means for every 100 parts produced, 9 are scrap. It means nearly ¥2 million per year in material costs, machining costs, and inspection costs — thrown into the scrap bin.
The workshop director didn't understand. The equipment manager didn't understand. Even the auditing customers didn't understand —"Your vibration control is so good. How is your yield only 91%?"
No one could answer that question.
Until one day, an edge computing engineer walked into the workshop and said something that silenced everyone:
"Your ruler is fine. But you're measuring the wrong thing."
Let's go back to that "perfect" threshold — 0.5μm.
Where did this number come from? It came from the equipment supplier's factory standards, from the ISO 10816 vibration grade table, from a simple logic: the larger the vibration amplitude, the worse the spindle condition. Exceed 0.5μm, there's risk — shut down and stay safe.
Is the logic correct? Yes.
But it has a fatal blind spot —it only looks at "amplitude," not "frequency."
Here's an analogy: you go to the hospital for a checkup. The doctor only takes your temperature. Below 37.5°C: normal. Above 37.5°C: fever, take medicine.
Is there a problem with this logic? Yes. Because the same 37.5°C could mean you just finished a run, could be the onset of a cold, or could be early-stage leukemia. The temperature is accurate — but looking at temperature alone, you'll miss every real disease.
Spindle vibration works the same way.
A 0.5μm amplitude could be minor tool wear (no problem), could be workpiece clamping eccentricity (no problem), or it could be a 0.03mm spall on the spindle bearing inner race — and that spall might only show up as 0.12μm in amplitude, far below the 0.5μm alarm line.
But it's already killing your yield.
This is the true deception of the 0.5μm threshold: it blocks all the "major diseases" but lets through all the "chronic diseases." And chronic diseases are the real killers of yield.
How exactly were those 9% defective parts produced?
I had that engineer pull three months of data and do one thing:don't look at amplitude — look at the spectrum.
The results made everyone's blood run cold.
During the machining periods corresponding to those 9% defective parts, the spindle vibration amplitude wasall below 0.5μm— meaning under the original monitoring logic, all those periods were judged as "normal." The line never shut down.
But the spectrum told a different story:
Those 9% defective parts weren't "sudden failures." They were produced day after day, part by part, under the "umbrella" of 0.5μm.
Your line never stopped. But your yield was bleeding every single day.
This is the truth that silenced everyone: you weren't without monitoring.You were monitoring a "fake health."
So how do you see this "fake health"?
The answer is four words:nanometer-level spectrum analysis.
Traditional vibration monitoring logic: collect vibration signal → calculate RMS amplitude → compare to threshold → alarm if exceeded. The entire process focuses on one metric —how muchit's vibrating.
Nanometer-level spectrum analysis logic: collect vibration signal → perform FFT (Fast Fourier Transform) → unfold the frequency domain → see which frequencies are abnormal → identify fault type → predict yield impact.
It doesn't care"how much it vibrated."It cares"how it vibrated."
Because different faults leave different "fingerprints" at different frequencies:
You see it? Every fault killing your yield is"disguised" as normal in amplitude.Only the spectrum can tear off that disguise.
And "nanometer-level" means: spectrum analysis resolution can reach0.01μm amplitude resolutionand0.1Hz frequency resolution.This means even a 0.03mm micro-spall on the bearing surface — the characteristic signal it excites in the spectrum — can be precisely captured.
This isn't "a more sensitive alarm."This is a completely different diagnostic dimension.
You might ask: if spectrum analysis is so good, why not send the data to the cloud and let a large model analyze it?
Because you can't afford to wait.
Precision machining spindle speeds are typically 8,000–12,000 RPM. A single machining cycle might be only 3–5 seconds. In those 3 seconds, if spectrum analysis isn't complete, you've missed the diagnostic window for that part.
Let's do the math:
| Solution | Sampling Rate | FFT Computation | Single Analysis Latency | Keeps Up with Cycle? |
|---|---|---|---|---|
| Cloud solution | 10 kHz | Full spectrum (4096 points) | 320–800 ms | Completely too slow |
| Edge solution | 10 kHz | Focused band (256 points) | 5–8 ms | Real-time tracking |
The cloud solution's latency means by the time your analysis finishes, the part is already machined. You're not doing quality control —you're doing an autopsy.
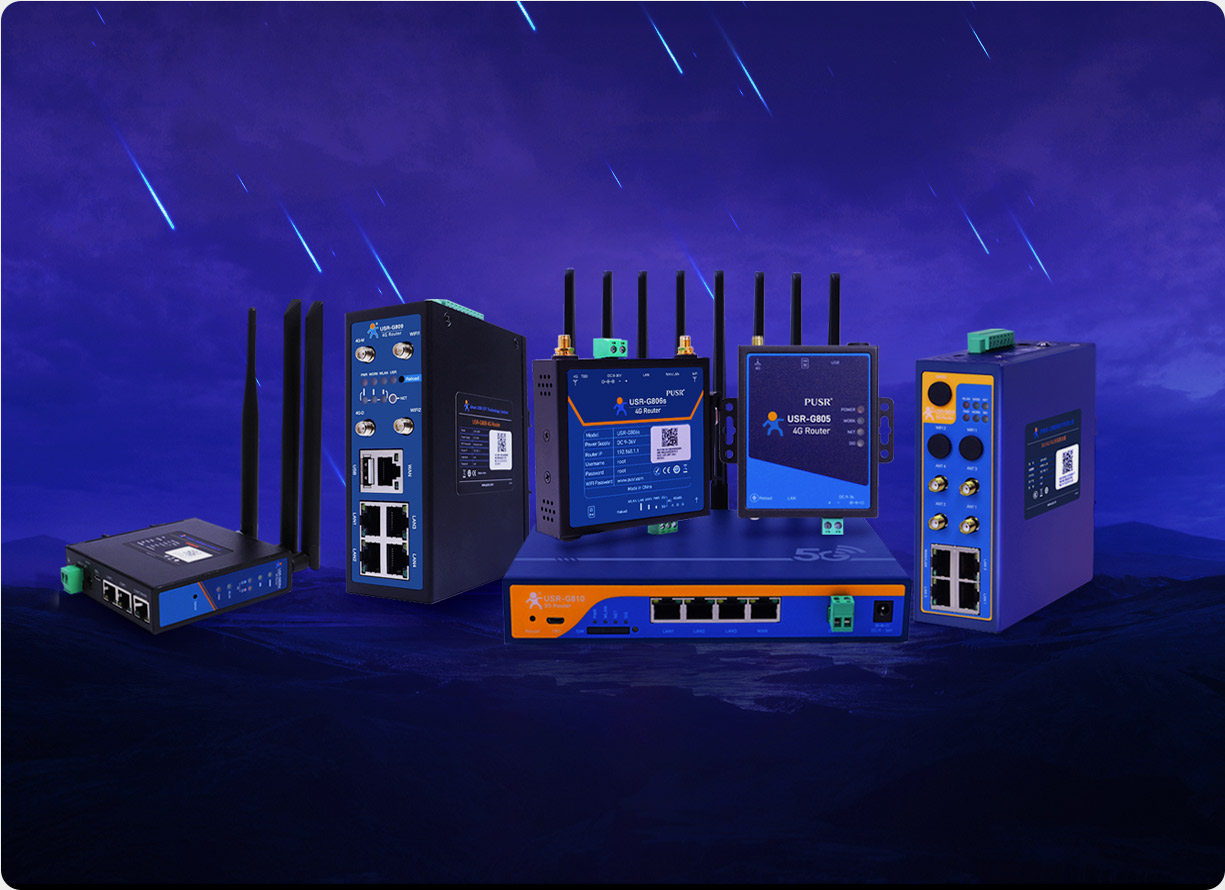
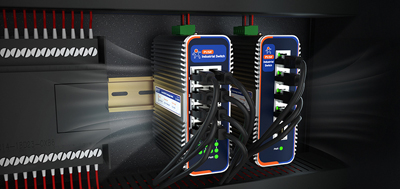
IoT gateway devicesput the FFT computation right next to the production line. Vibration sensor data never leaves the workshop — spectrum unfolding, feature extraction, and fault matching are all completed locally on theIoT gateway devices.From vibration signal entering theIoT gateway devicesto diagnostic result output: the entire process takes no more than8 milliseconds.
What's 8 milliseconds? At 12,000 RPM, the spindle completes one revolution in 5 milliseconds. That meansspectrum analysis is faster than one spindle revolution.
Every single part is "health-checked" while it's being machined. Defective parts are intercepted before they become scrap.
This is the technical foundation of 99.7% yield — not stricter standards, butearlier detection.
Back to that precision machining line in East China.
After deployingIoT gateway devices+ nanometer-level spectrum analysis, here's three months of data:
| Metric | Before | After | Change |
|---|---|---|---|
| Yield | 91.3% | 99.7% | +8.4 pp |
| Monthly scrap loss | ¥420K | ¥68K | −84% |
| Annual shutdowns | 11 | 3 | −73% |
| Customer complaints | 17/year | 1/year | −94% |
An 8.4 percentage point yield improvement means what?
It means saving over¥4 million per yearin scrap losses. It means that line which once silenced everyone is now the "benchmark line" during customer audits. It means the workshop director no longer has to explain"Why is yield so low when vibration control is so good?"
Because the ruler changed. It's not stricter — it's more accurate.
Let me say something that might make you uncomfortable:
Your line may have never "had a problem." It's just been "producing scrap" all along.
The 0.5μm threshold protected your equipment but betrayed your yield. You thought you were doing preventive maintenance — but you were actually doing"selective blindness"— only seeing the big, missing the small; only seeing amplitude, missing frequency; only seeing equipment, missing product.
Nanometer-level spectrum analysis isn't some black magic. It just lets you finally see a fact you should have seen long ago:
Every spindle vibration is talking. You just weren't listening.
IoT gateway devicesaren't some futuristic gadget either. It's just someone who "understands the language" — placed right next to your production line.
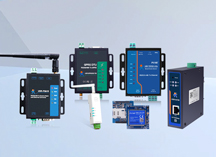
If you're looking for anIoT gateway devicethat can run FFT locally, connect to 200+ industrial protocols, and let you drag-and-drop diagnostic logic in Node-RED — take a look atUSR-M300 by USR IoT.1.2 GHz dual-core, 2,000 acquisition points in parallel, industrial temperature range, DIN rail mounting — basically purpose-built for this "nanometer-level real-time diagnosis" scenario.
Not pushing hard. Just saying: in this space, products that nail both "compliance" and "usability" at the same time?They're rare.
Your yield deserves a better ruler.