May 9, 2025
Integrated IoT Display in Energy Management Monitoring Platform
Integrated IoT Display in Energy Management Monitoring Platform: Unlocking a New Paradigm for Energy Management
In the current era of vigorous development of Industrial Internet of Things (IIoT) technology, energy management monitoring platforms have become the core fulcrum for enterprises to achieve cost reduction, efficiency enhancement, and green transformation. As the "intelligent hub" in this field, the integrated IoT display is reshaping the technical logic and commercial value of energy management with its innovative integrated and visualized form. This article will delve into how the integrated IoT display empowers energy management monitoring platforms.
1. Technological Integration: From "Data Silos" to "Omni-Domain Interconnection"
Traditional energy management monitoring platforms often face challenges such as scattered data, inconsistent protocols, and response delays. For example, an energy enterprise once encountered low data collection efficiency and time-consuming troubleshooting due to the use of different communication protocols by multi-brand electricity meters. The integrated IoT display breaks through this dilemma with its "three-in-one" technological architecture:
Protocol Unification: It is equipped with an industrial communication protocol library including OPC UA, Modbus, IEC 61850, etc., supporting seamless integration with devices such as smart electricity meters, sensors, and PLCs. For instance, in a photovoltaic power station project, the integrated display integrated data from devices like inverters, combiner boxes, and weather stations through unified protocols, enabling real-time optimization of power generation efficiency.
Edge Computing Empowerment: It integrates an edge computing gateway to achieve local data preprocessing. For example, in a chemical plant project, the integrated display conducted real-time analysis of steam pipeline pressure and temperature data through edge computing, providing early warning of leakage risks and avoiding unplanned shutdowns.
Multimodal Interaction: It supports multi-dimensional interaction methods such as touch, voice, and gestures. For example, a data center operator can retrieve real-time energy consumption data of server cabinets through voice commands, significantly improving operational efficiency.
2. Scenario Implementation: From "Passive Response" to "Proactive Optimization"
The value of the integrated IoT display lies not only in technological integration but also in its deep empowerment of the entire process of energy management. The following analyzes its commercial value through three typical scenarios:
Scenario 1: Smart Factory - Energy Efficiency Optimization and Equipment Health Management
An automobile manufacturing factory achieved three major breakthroughs by deploying the integrated IoT display:
Energy Consumption Transparency: It displays sub-item energy consumption data of workshops such as stamping, welding, and painting in real time, identifying issues like excessive energy consumption in the painting workshop's drying ovens. By adjusting process parameters, the factory saved a significant amount on annual electricity bills.
Predictive Maintenance of Equipment: It conducts real-time monitoring of vibration and temperature data of CNC machine tools, predicts bearing failures using AI algorithms, and reduces equipment downtime.
Energy Dispatch Optimization: Based on peak-valley electricity price strategies, it automatically adjusts the start-stop times of equipment such as air compressors and chillers, reducing electricity expenses.
Scenario 2: Smart Park - Collaborative Management of Distributed Energy Resources
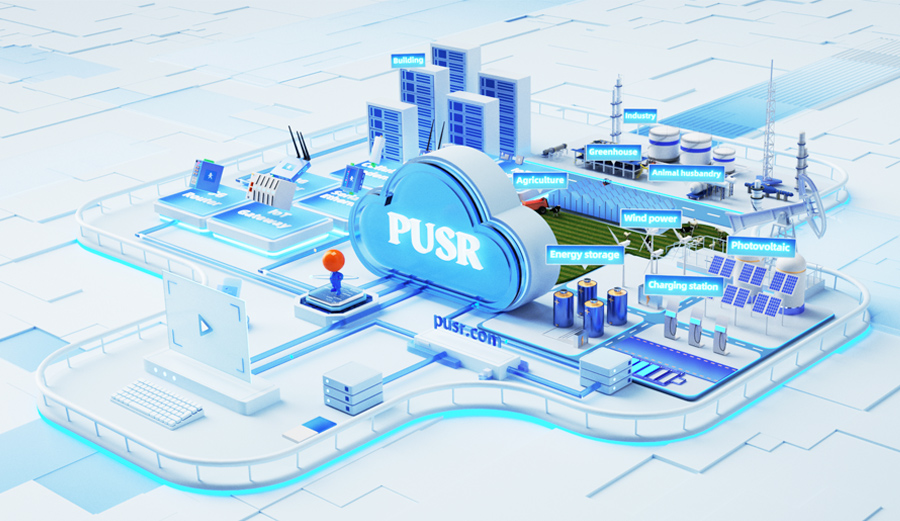
A technology park integrated distributed energy resources such as photovoltaics, energy storage, and charging piles through the integrated display, achieving three major values:
Power Generation Forecasting and Grid Connection Scheduling: It predicts the future power generation of photovoltaic systems based on meteorological data and historical generation data, assists in grid scheduling, and reduces the curtailment rate.
Demand Response: It dynamically adjusts adjustable loads within the park according to grid load fluctuations, participates in electricity market transactions, and increases annual revenue.
Carbon Footprint Tracking: It calculates the carbon emission intensity of the park in real time, generates carbon emission reports, and helps enterprises achieve ESG goals.
Scenario 3: Smart Building - Balancing Comfort and Energy Consumption
A commercial complex achieved three major innovations through the integrated display:
Environmental Perception and Regulation: It links temperature and humidity sensors with CO₂ sensors to automatically adjust the operating parameters of air conditioning and fresh air systems, enhancing customer comfort while reducing air conditioning energy consumption.
Intelligent Lighting Control: It realizes on-demand start-stop of the lighting system through human body induction and light intensity sensors, saving annual electricity costs.
Energy Consumption Auditing and Publicity: It displays real-time energy consumption data on large screens in public areas, stimulating tenants' awareness of energy conservation and promoting green operations.
3. Commercial Opportunities: From "Cost Center" to "Value Engine"
The implementation of the integrated IoT display not only improves energy management efficiency but also opens up new business models:
Data Service Monetization: By collecting and analyzing equipment operation data, it provides enterprises with value-added services such as energy consumption auditing and energy efficiency diagnosis. For example, an energy service company offers "energy consignment" services to small and medium-sized manufacturing enterprises based on integrated display data, sharing savings according to energy efficiency benefits.
Predictive Maintenance Market: It combines equipment health management data to offer predictive maintenance services. For example, a wind turbine manufacturer monitors the operating status of units through the integrated display, identifies potential gearbox failures in advance, avoids customer losses, and expands service revenue.
Carbon Asset Management: Relying on the carbon emission data from the integrated display, it provides enterprises with services such as carbon inventory and carbon trading consulting. For example, a consulting company helps export enterprises generate carbon footprint reports through the integrated display to meet the requirements of the EU Carbon Border Adjustment Mechanism (CBAM) and seize international market opportunities.
Energy Finance Innovation: It combines integrated display data with blockchain and digital twin technologies to develop financial products such as green credit and carbon asset pledges. For example, a bank provides low-interest "energy-saving loans" to enterprises based on their energy consumption data from the integrated display to support technological upgrades.
4. Future Outlook: From "Single-Point Breakthrough" to "Ecological Win-Win"
With the advancement of the "dual carbon" goals, the integrated IoT display will evolve in three directions:
Deep Integration of AI: It achieves automatic attribution and strategy generation for energy consumption anomalies through AIGC technology. For example, the integrated display can automatically analyze historical data and generate optimization suggestions such as "raising the air conditioning temperature by 1°C in summer can save energy."
Expansion of Digital Twins: It constructs virtual mirrors of energy systems to achieve fault simulation and optimization. For example, in power grid planning, it simulates the reliability of different topological structures through the digital twin function of the integrated display to reduce investment risks.
Construction of an Open Ecosystem: It connects with third-party platforms through API interfaces to form an energy management ecosystem. For example, the integrated display can access electricity market trading platforms to automatically participate in demand response or link with supply chain systems to achieve cross-enterprise sharing of energy consumption data.
Embarking on a New Chapter of Energy Management with the Display as the Medium
The integrated IoT display is not just a technological tool but also a catalyst for the energy management revolution. It makes data flow, enables devices to think, and enhances energy efficiency. For enterprises, deploying the integrated display is not only a technological upgrade but also a strategic choice—it helps them seize the initiative in green transformation amidst rising energy costs and tightening carbon constraints. For practitioners, mastering the technical and commercial logic of the integrated display is the key to unlocking the future energy management market. Let us join hands and leverage the integrated IoT display as a fulcrum to unlock the infinite possibilities of energy management!
Industrial loT Gateways Ranked First in China by Online Sales for Seven Consecutive Years **Data from China's Industrial IoT Gateways Market Research in 2023 by Frost & Sullivan
We use cookies to ensure that we give you the best experience on our website. If you continue to use this site we will assume that you are happy with it.